
StreetView
Automate mapping of urban vegetation from street level imagery to create a layer for exploring which areas of a city might be at greater risk during future heat waves.
Why This Matters
Urbanization is a global trend, while climate change exacerbates challenges to urban quality of life, including extreme heat. Cities can intensify extreme heat, leading to the urban heat island phenomenon. It will be increasingly important to understand how to mitigate and plan for warming cities, understanding the drivers and the effectiveness of various countermeasures. We expect that citizen science approaches to urban heat island mapping will improve participants' perceptions of heat hazards, support the design of effective nature-based solutions, and enhance advocacy for humanitarian interventions.
Our Impact
Join us to help communities better understand and prepare for extreme heat events! By automating the mapping of urban vegetation from street-level imagery, we're creating valuable data that helps the Red Cross and local communities identify areas most vulnerable to heat-related hazards. Our open-source tools enable more informed planning for climate adaptation and support the design of effective nature-based solutions to combat urban heat islands.
Geography / Reach
The initial project focus is Indonesia - but will be open source and can be used globally.
Community Partners
American Red Cross, International Services Department (nonprofit), and the Indonesian Red Cross (nonprofit).Our Story
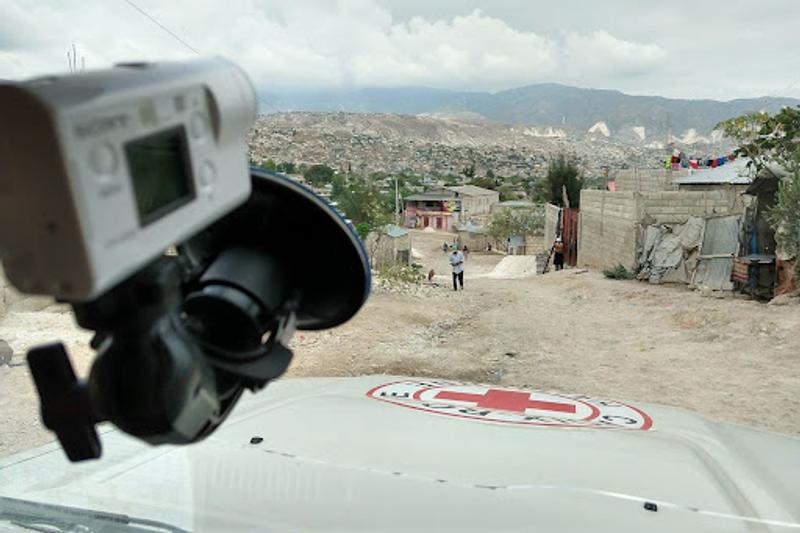
As part of his work at the American Red Cross, Dan has collected street-level imagery in a variety of contexts including: tracking the rapidly urbanization of Canaan, Haiti where the Red Cross was supporting residents through health, infrastructure, and livelihoods programs; documenting the aftermath of hurricane Irma in Dominica as teams traveled around the island assessing and providing support; and improving map data in the Philippines working alongside the Philippine Red Cross on recovery activities that include training volunteers in communities on disaster prevention and preparedness. During the 2018 domestic response to Hurricane Michael, the American Red Cross collected more than 539,000 images of Panama City, Florida.
The images were used in an experimental crowdsourcing review tool to identify damages, and later as the training data for trying a machine learning enabled automated damage assessment process. This project builds on that previous work while seeking to leverage more recent advances in machine learning tools and techniques.
Come Join Us
Everyone is welcome, no matter your skill level or background. We especially need help with:
- Machine learning for image analysis
- Geospatial analysis and visualization
- Python